Week Six: Index Health with Brent Ozar's First Responder Kit
- Jun 11, 2025
- 4 min read
Earlier, in Week 3, I had explored Glenn Berry’s Diagnostic Queries and Microsoft’s Best Practices Checker. Both of those do give some useful insights into index health. Just enough to acknowledge it without really diving in. But sp_BlitzIndex digs deeper. It doesn’t just tell you something’s off, it shows you exactly how and why, with enough detail to take action right away.
When you're working with large datasets (especially the heavy ones) index tuning isn’t just a nice-to-have. It's something you need to stay on top of, or performance can take a hit fast. That said, it’s easy to make things worse if you’re not careful. Dropping or adding indexes without understanding their impact can backfire. Brent Ozar’s sp_BlitzIndex (part of the First Responder Kit) came into play.
I’ve been leaning on it more and more lately. It gives a clear snapshot of how your indexes are actually behaving, what's getting heavy write activity, what barely gets read, what overlaps with something else, or what's completely missing. It’s a solid tool if you’re trying to figure out what to clean up, keep or rethink.
Just to keep it all in one place, here’s a quick breakdown of the commonly used @Mode options for sp_BlitzIndex:
@Mode = 0 – Default. Flags the most pressing issues.
@Mode = 1 – Gives you a high-level summary of index usage across the database.
@Mode = 2 – Focuses purely on usage stats (reads, writes, etc.).
@Mode = 3 – Shows only missing index suggestions.
@Mode = 4 – Brings up everything else, including small objects and less urgent findings.
In my case, I was focused on just a few specific databases, so I used this:
EXEC dbo.sp_BlitzIndex
	@DatabaseName = 'DatabaseName';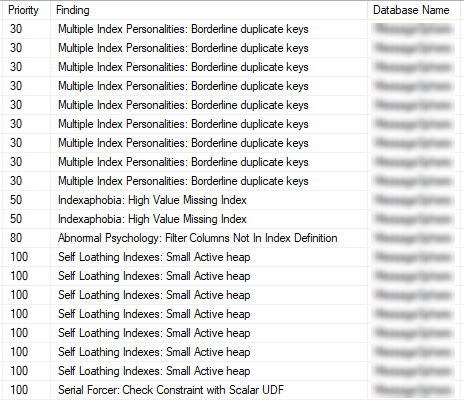
And when I needed to zoom in on a particular table:
EXEC dbo.sp_BlitzIndex
	@DatabaseName = 'DatbaseName'
	,@SchemaName = 'dbo',
	,@TableName = 'LogTable';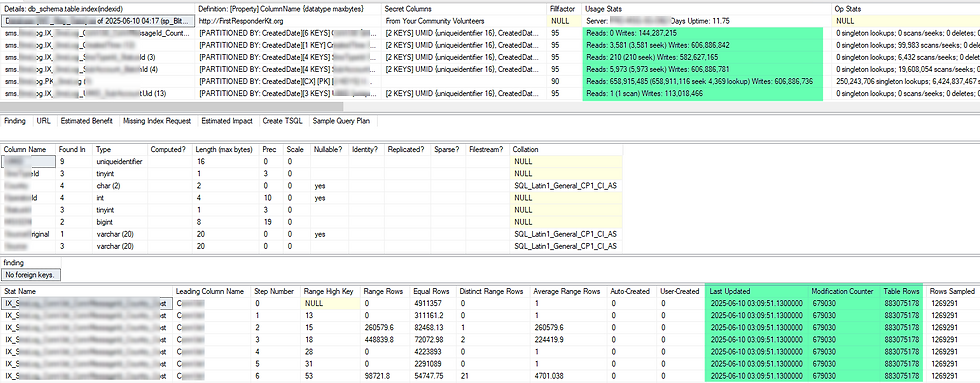
These made it easier to narrow the results and stay focused on the areas I actually cared about.
It's crucial to note that I didn't start dropping or adding indexes indiscriminately. I went through each finding carefully. I cross-referenced usage stats, looked at execution plans and tracked down which procedures were touching these indexes. I also used the "Create TSQL" and "More Info" links included in the results to dig further where needed.
Some indexes were clearly redundant, two or more indexes covering almost the same columns or indexes that could be consolidated into one. Others had high write counts but zero reads. There were also cases of suggested missing indexes that I was able to fold into existing definitions with a few tweaks. Even without touching most of the indexes yet, this process gave me a working baseline for future changes.
That baseline turned out to be a valuable guide when I built a new version of one of our key tables. I structured the new table, keeping all the lessons from sp_BlitzIndex in mind. I tested every major read, insert and update pattern in a Staging environment. Checking execution time, IO statistics and the query plans. Brent’s tool gave me the clarity to avoid over-indexing and target the structures that would really make a difference.
Understanding the Columns
The sp_BlitzIndex output includes a bunch of columns. Some are obvious, others take a bit of interpretation. Here’s how I personally read them:
Priority – A rough measure of how urgent or important this finding is. Higher = more attention needed.
Finding – Short description of the issue. Sometimes vague, sometimes very specific.
Database Name – Good when you’re scanning across multiple databases.
Details – This is where you’ll see read/write activity for the index, as well as the index name itself.
Definition – Lists the key columns that make up the index.
Secret Columns – Here’s a fun one. SQL Server automatically includes all columns from the clustering key in any nonclustered index. These don't show up in the Definition, but they’re there behind the scenes.
Usage – Read and write metrics. Useful for spotting unused or overly expensive indexes.
Size – Both the number of rows and the on-disk size of the index.
More Info – A T-SQL script you can run to get additional context on the table the index is on.
URL – To give you more info about the finding.
Create TSQL – If you need to recreate the index for any reason, this gives you the exact script.
Sample Query Plan – This has always been NULL for me, but it’s there in case it ever isn’t.
Once you get familiar with those, the output starts feeling less like a wall of noise and more like a cheat sheet.
One final thing worth repeating: don’t test index changes directly in production. I know it’s tempting sometimes, but unless you have no other option, use a Staging or a Development environment. Index tuning is slow, iterative work. Make a change, let it settle, observe and then decide whether to keep or adjust.
If you haven't explored sp_BlitzIndex yet, now is the time. It won't fix everything, but it will illuminate the path to better performance. It doesn’t magically fix things for you, but it makes what’s broken a lot easier to see and that’s half the battle.


Comments