Week Five: Part 1 - Working Smart with Very Large Tables in SQL Server 2022
- May 28, 2025
- 6 min read
By automating sp_WhoIsActive and deploying it across all our production SQL Servers, I’ve built a pretty reliable, near-real-time view of what’s happening under the hood. Query activity, blocking chains, execution plans, long running transactions — it’s all there, getting logged consistently.
It’s not just about having a fancy logging setup for the sake of it. This has become one of my go-to resources when something feels off, especially in environments with heavy transactional workloads. With just a simple query, I can step back in time and see what the server was busy with, even if the moment has passed. And that’s key, especially when issues are intermittent or hard to reproduce.
This kind of historical activity logging is like having CCTV footage for your database. You might not watch it all day, but when something breaks or slows down, you’re glad it’s there.
The Latency Problem Nobody Wanted to Own
A few weeks in, I was asked to look into a recurring latency issue that had been haunting one of our most critical databases. The symptoms weren’t exactly new , users reporting slow performance, latencies, alerts firing here and there. But this time, the slowness was more persistent. And more painful.
As I combed through the sp_WhoIsActive logs, a clear pattern started to show. Every time there was a spike in inserts or updates on this one specific table, things got messy. Wait times climbed, blocking sessions piled up and overall throughput took a noticeable hit. It didn’t take long to trace it back to a classic case of last page insert contention. Basically, because the clustered index uses an ascending key, all the new rows were landing on the same page. With multiple sessions trying to insert at once, that single page became a hot spot — a bottleneck where everything got stuck waiting in line.
Now, the table in question? It's not just any table. It sits at the heart of the business, handling high-frequency transactions, feeding downstream systems/applications and taking in thousands of inserts per minute during peak hours. So naturally, this isn’t something that can tolerate downtime or performance degradation.
What Does "Very Large" Even Mean?
At this point, it’s probably worth pausing and asking: what do we mean when we say very large table?
It’s one of those definitions that really depends. Some folks might say anything over 1TB is a big deal. Others won’t blink until you cross 20TB. But for me, it's not just about the size in gigabytes or terabytes. A table becomes very large the moment you have to treat it differently. When regular maintenance tasks start requiring special care, when rebuilds become risky and queries start behaving differently — that's when a table earns its "very large" badge. And this table had earned it!
Digging Into the Bottleneck:
Here’s how I started tackling it:
Index Fragmentation & Maintenance This was my first instinct. Check for fragmentation and clean it up. Sounds simple enough, right? Except, on these "very large" tables, I even went as far as tweaking Ola Hallengren’s well-known IndexOptimize maintenance script, adjusting parameters to be as gentle as possible: online rebuilds, WAIT_AT_LOW_PRIORITY, the works. I learned this the hard way. The operation for some reason holds unexpected schema lock causing cross blocking which leads delay in 3.92 minutes processing time. No matter how nicely I asked SQL Server to keep things non-intrusive, it just wasn’t going to cooperate.
Deeper Analysis Through Logging & Monitoring That’s when I turned back to the sp_WhoIsActive logs, PerfMon counters and Grafana dashboards. I wanted to understand the workload pattern over time — CPU usage, memory pressure, read/write trends, wait types, all of it. And soon enough, the pattern started to emerge.


Figure 1 – Latencies observed for inserting
Experiencing frequent delays in Log_Insert SP and in some cases when handling large volume of data, spike reaches at an unacceptable phase. An example from our Grafana dashboard shows latency occurred in inserting and SQL Server monitoring indicates DB1 and DB2 database are IO hotspots (both residing on data disk D:).

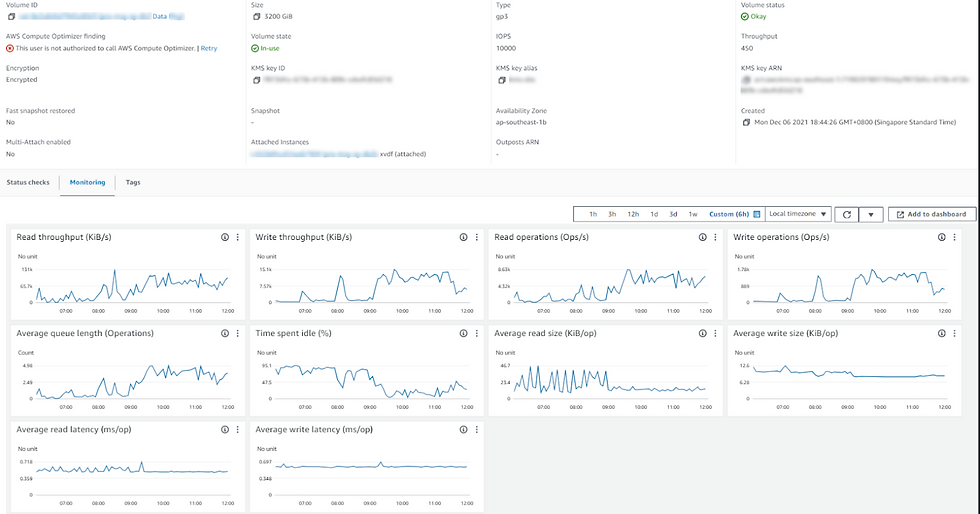
Figure 2 – Average Disk Queue Length and sec/Read
PerfMon and AWS EBS show high latency associated with read and write data from disk during this timeframe, accompanied by a sharp rise in the average disk queue length. It seems that the disk subsystem is becoming a bottleneck; it is struggling to keep up with the number of requests, SQL Server disk IO performance is deteriorating and queues are forming.

More interesting in this case, at the exact time we see dramatic rises in disk IO latency, we also see a sustained drop in page life expectancy (should be at least 5 minutes), which indicates a period of memory pressure, where SQL Server was forced to flush pages from the cache to make room for other requested pages.


Figure 3 – PAGEIOLATCH waits accumulated across all requests since PROD DB server was last reset
PAGEIOLATCH_xx wait appears high in this historical list which caused average read stalls (latency) over 100ms. This threshold is extremely high. We can determine as well at the transaction level the execution statistics that PAGEIOLATCH_xx waits took 100++ms on a consistent basis, and should generally stay below 10-15 milliseconds per IO request.
This means that requests had to wait to obtain a latch, in order to read in from disk pages not held in the buffer pool. If the disk subsystem cannot return pages quickly enough then it could lead to a long queue of requests waiting to obtain pages, and latch contention.
These I/O performance problem may cause the following behavior to occur as well:
Blocking
Slow response time
Stretching of resource boundaries (CPU utilization in our case)

Figure 4 – Top Waits list showing PAGEIOLATCH_SH
After careful investigation, I observed that this slowness occurs when SQL workload has a high number of concurrent selects, inserts and updates. Many threads with PAGEIOLATCH_SH wait type on the same page resource, particularly DB1 and DB2 databases.
Perhaps the problem is not the disk subsystem after all, but an undersized buffer pool or simply just very inefficient queries requesting many pages that aren't in the buffer pool.

Figure 5 – SQL Errorlog Constant FlushCache Messages
As you can see there are constant FlushCache messages (related to drop in Page Life Expectancy counter) in SQL error log when we experience database slowness, which means in a very short interval (60 seconds by default) a lot of data in the database was changed, turning pages in the buffer pool from clean to dirty. The resulting FlushCache made the IO subsystem work very hard to keep up with the IO.
Further Comments
The resulting excessive numbers of page reads is causing "cache churn" as SQL Server flushes buffer pages to disk in order to accommodate new pages, the consequence of which is a 'disk bottleneck', and sessions waiting to obtain buffer cache latches on pages that need to be read from disk.
Ultimately, we should consider adding more memory which will allow more data/index pages to be cached and not re-read from disk frequently. These checks from SQL Watch indicate a need for more memory.

To Fix the Problem
By reviewing all relevant performance metrics as a unit, I have the best chance of choosing the most effective course of action. In this case, it's clear that initial efforts should be directed towards:
Memory
Increase memory dedicated to SQL server (surprisingly, memory allocated to SQL server was very low)
I used dbatools Test-DbaMaxMemory

Enable Hybrid Buffer Pool feature (MS reference)
Make the storage do to less work
Query issues - Tune inefficient queries by examining the associated execution plan to find unfiltered conditions, very large table scans and expensive operators.
Update statistics - To prove query optimizer sufficient information to choose the best plan.
Resolution
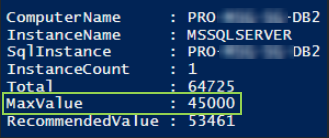
Increase SQL 'max server memory (MB)' configuration from 26730 to 45000.
Before: Memory 26730

After: Memory 45000


Summary
As shown on figures above, increasing the memory dedicated for SQL Server we achieved our desired state, several benefits for optimizing performance and resource utilization. Here's a brief summary of the advantages:
Improved Performance: Increasing the 'max server memory' allows SQL Server to use more memory for its buffer pool and caches. As a result, improved query performance, reduced disk IO, faster retrieval of data, especially for complex queries such as MessageSphere database, and improved overall performance of Log_Insert (30ms mean vs 400-500ms).
Reduced Disk I/O: With more memory allocated to SQL Server, there is a reduced need to read data from disk, as more data and execution plans can be stored in memory. This helps minimize disk IO, which causes degraded disk and database performance.
Enhanced Query Execution: More available memory enables SQL Server to cache execution plans, reducing the need for frequent recompilations. This led to faster query execution times and improved overall responsiveness of the database.
Optimized Buffer Pool: The buffer pool is a critical component of SQL Server's memory architecture, responsible for caching data pages. Increasing 'max server memory' allows for a larger buffer pool, ensuring that frequently accessed data remains in memory for quick retrieval.
Better Handling of Workloads: Our system with high concurrent user activity and workload benefits from increased 'max server memory.' It helps SQL Server efficiently manage the memory demands of multiple concurrent processes, preventing memory-related performance issues.
Prevention of Paging: Adequate memory allocation helps prevent paging, where data is moved between RAM and the page file on disk. Paging can significantly degrade performance, and increasing 'max server memory' mitigates this risk.
Cost-Efficient Resource Utilization: Efficient use of memory resources translates to cost savings by avoiding unnecessary expenditures on immediate disk upgrades. We benefit from improved performance without the immediate need for additional hardware investments.


Comments